Welcome to Wumbolytics.
Our insights and data analytics of resident activities across our portfolio of buildings in Australia and New Zealand from luxury boutique addresses to super towers and mixed-use complexes. Our purpose of sharing these insights is to assist Property Developers and Consultants team to create exceptional vertical living environments that a purpose fit for the location and for future residents to enjoy and love where they live.
THE MOST USED FACILITIES
Super Towers in the last 6 months
AVERAGE PARCEL COLLECTIONS
Statistics in the last 12 months
100per day
MOVE IN/OUT
Statistics in the last 12 months
1,229per month
GENDER
Statistics in the last 6 months
Female 52%Male 48%

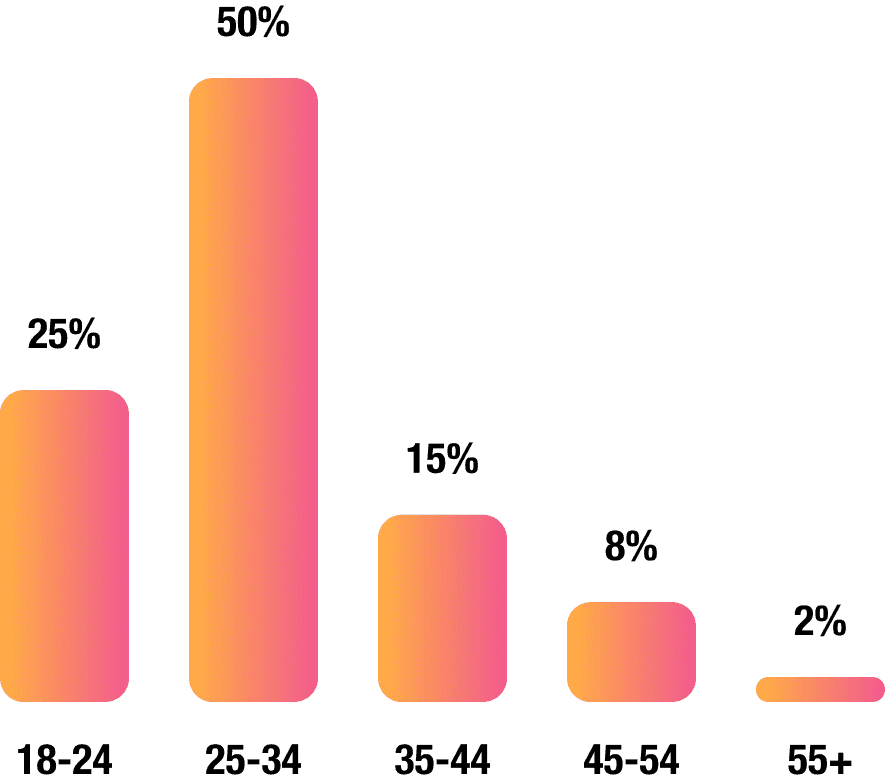
AGE GROUPS
Statistics in the last 6 months

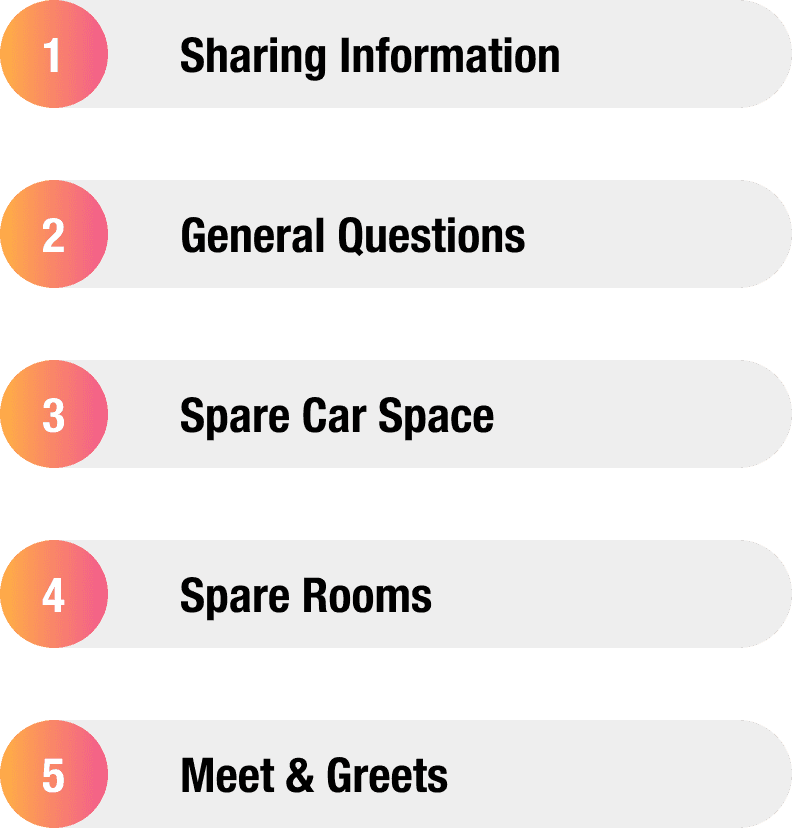
TOP 5 POSTED TOPICS IN SOCIAL HUB
Statistics in the last 6 months

PETS
Statistics in the last 6 months
Cats 60%Dogs 30%Other 10%

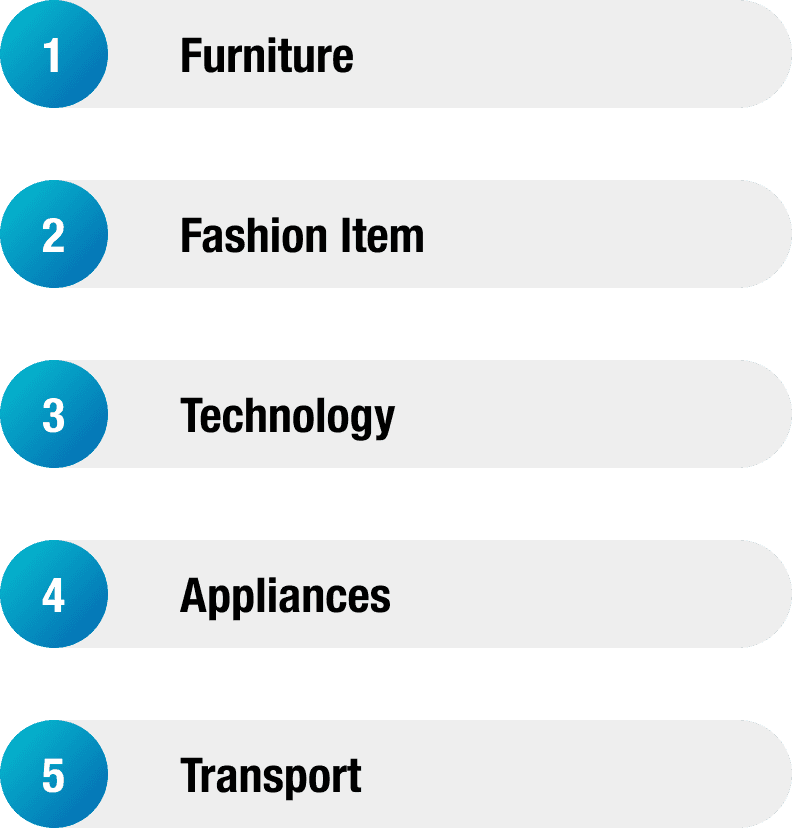
MARKETPLACE MOST POSTED ITEMS
Statistics in the last 12 months

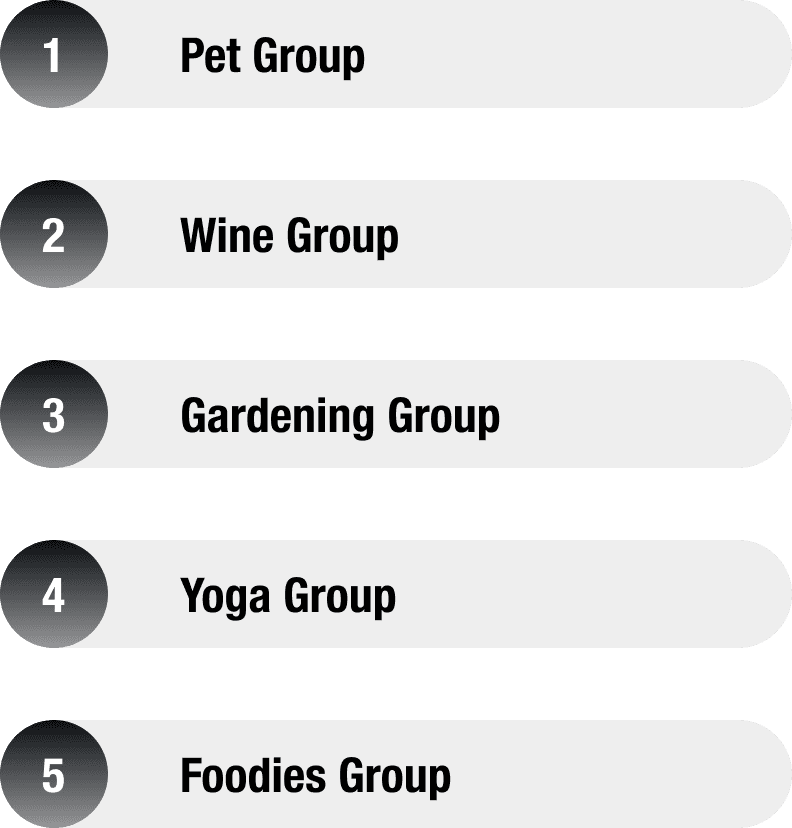
MOST POPULAR SOCIAL GROUPS
Statistics in the last 12 months


